Q2 Debugger: Inspect Tecton Q2 API Calls
The Q2 Debugger is a Chrome add-on developed by Nueve Solutions. This free tool allows users to inspect Tecton Q2 API calls in a similar way to the Chrome network inspector. With the Q2 Debugger, users can track the routing_key and payload that was sent or received to or from the extension.
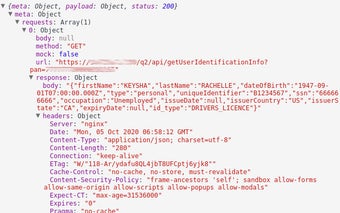
One of the main features of the Q2 Debugger is its ability to track requestExtensionData, which includes API calls to the Q2 backend extension. This makes it easy for developers to debug the Q2 extension backend by tracking meta.
The Q2 Debugger offers a user-friendly interface with resizable columns, making it convenient to view and analyze the data. Additionally, there is a button to clear the inspector, similar to the Chrome network inspector, for easier navigation.
Copying data from one of the cells, such as the Routing Key, is made simple with the right-click functionality. Users can easily copy the data they need for further analysis or reference.
To enhance the user experience, the Q2 Debugger provides both light and dark themes that match the Chrome debugger theme. This allows users to choose the theme that suits their preferences and provides a seamless integration with their Chrome browser.
Overall, the Q2 Debugger is a valuable tool for developers working with Tecton Q2 API calls. Its intuitive interface, tracking capabilities, and customization options make it a useful addition to the developer's toolbox.